Act Fast! Cities with the Most Competitive Real Estate Markets in 2021
This year, these twenty cities are seeing unprecedented demand on their housing markets compared to the rest of the nation.
The pandemic may have caused major negative economic repercussions this past year, but in certain industries, business is booming. Some sectors have even grown remarkably and achieved historic profits over the course of the pandemic. One such case is the U.S. housing market, which achieved a $2.5 trillion gain in 2020, the largest growth rate in a single year since 2005, according to Zillow. Evidently, house hunting has become a priority for many more Americans over this past year, increasing demand for real estate across the nation.
The housing market’s upward momentum in 2020 bodes well for 2021. Demand for real estate is projected to remain high across the country this year, and many potential homebuyers will face significant competition. It’s certainly a seller’s market. What’s more, some cities are seeing unrivaled demand, with homes practically flying off the market. To locate the cities with the highest levels of demand for homes in 2021, the researchers at Insurify crunched the numbers to identify the cities with the most competitive real estate markets.
Insights
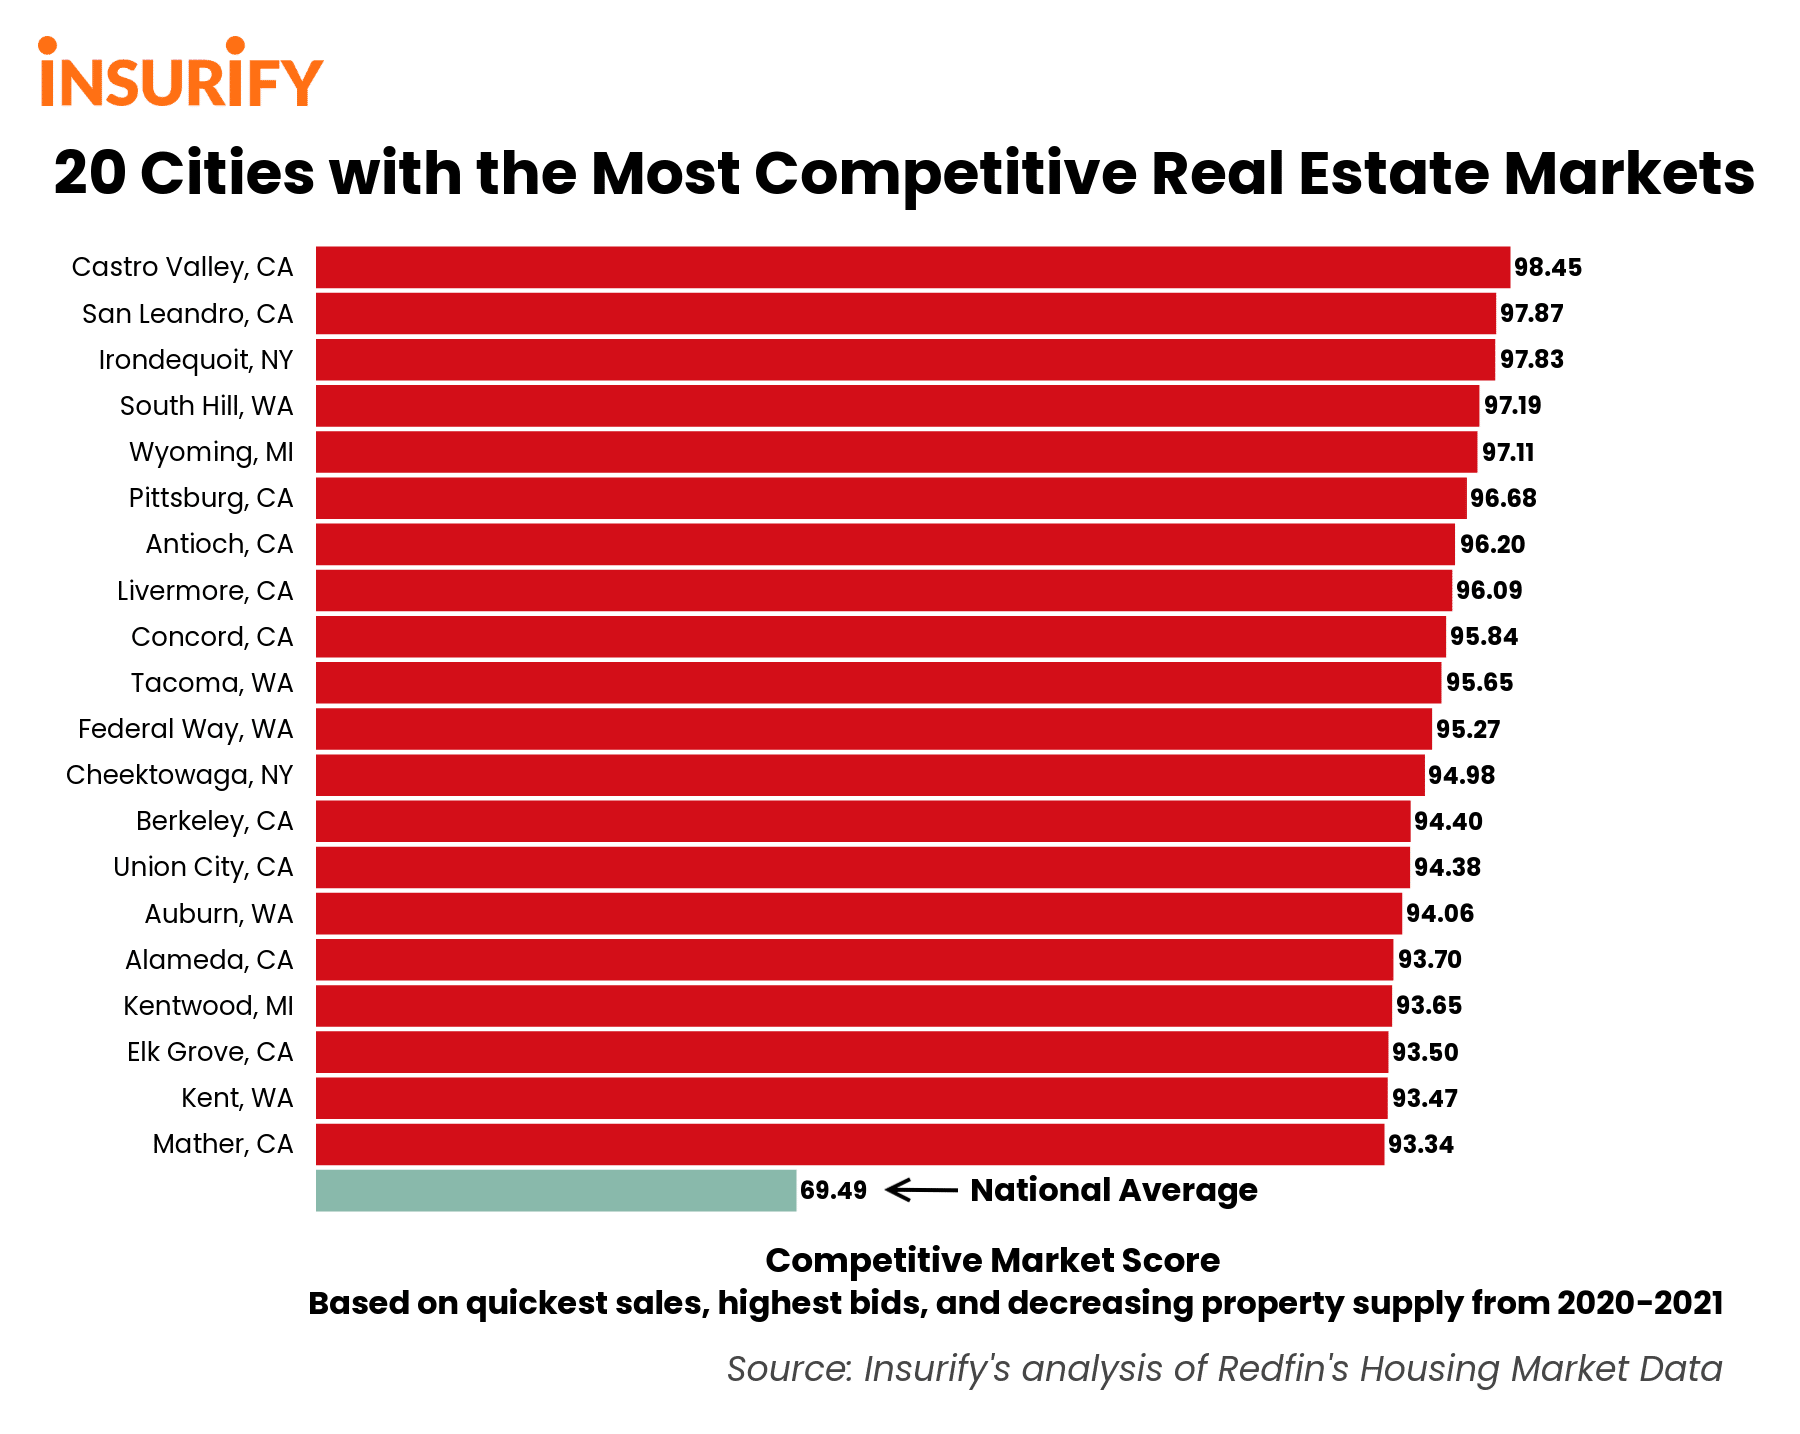
- National averages. Across the nation, the average city’s competitive market score is 69.49 out of 100. Between February 2020 and February 2021, 30 percent of homes were sold above their listing price, on average. In that same time period, an average of 45 homes per month sold within 2 weeks of their listing date, and the average month’s supply of property (inventory divided by home sales per month) was 2.09 months. Additionally, the average price per square foot of homes on the market was $231.48.
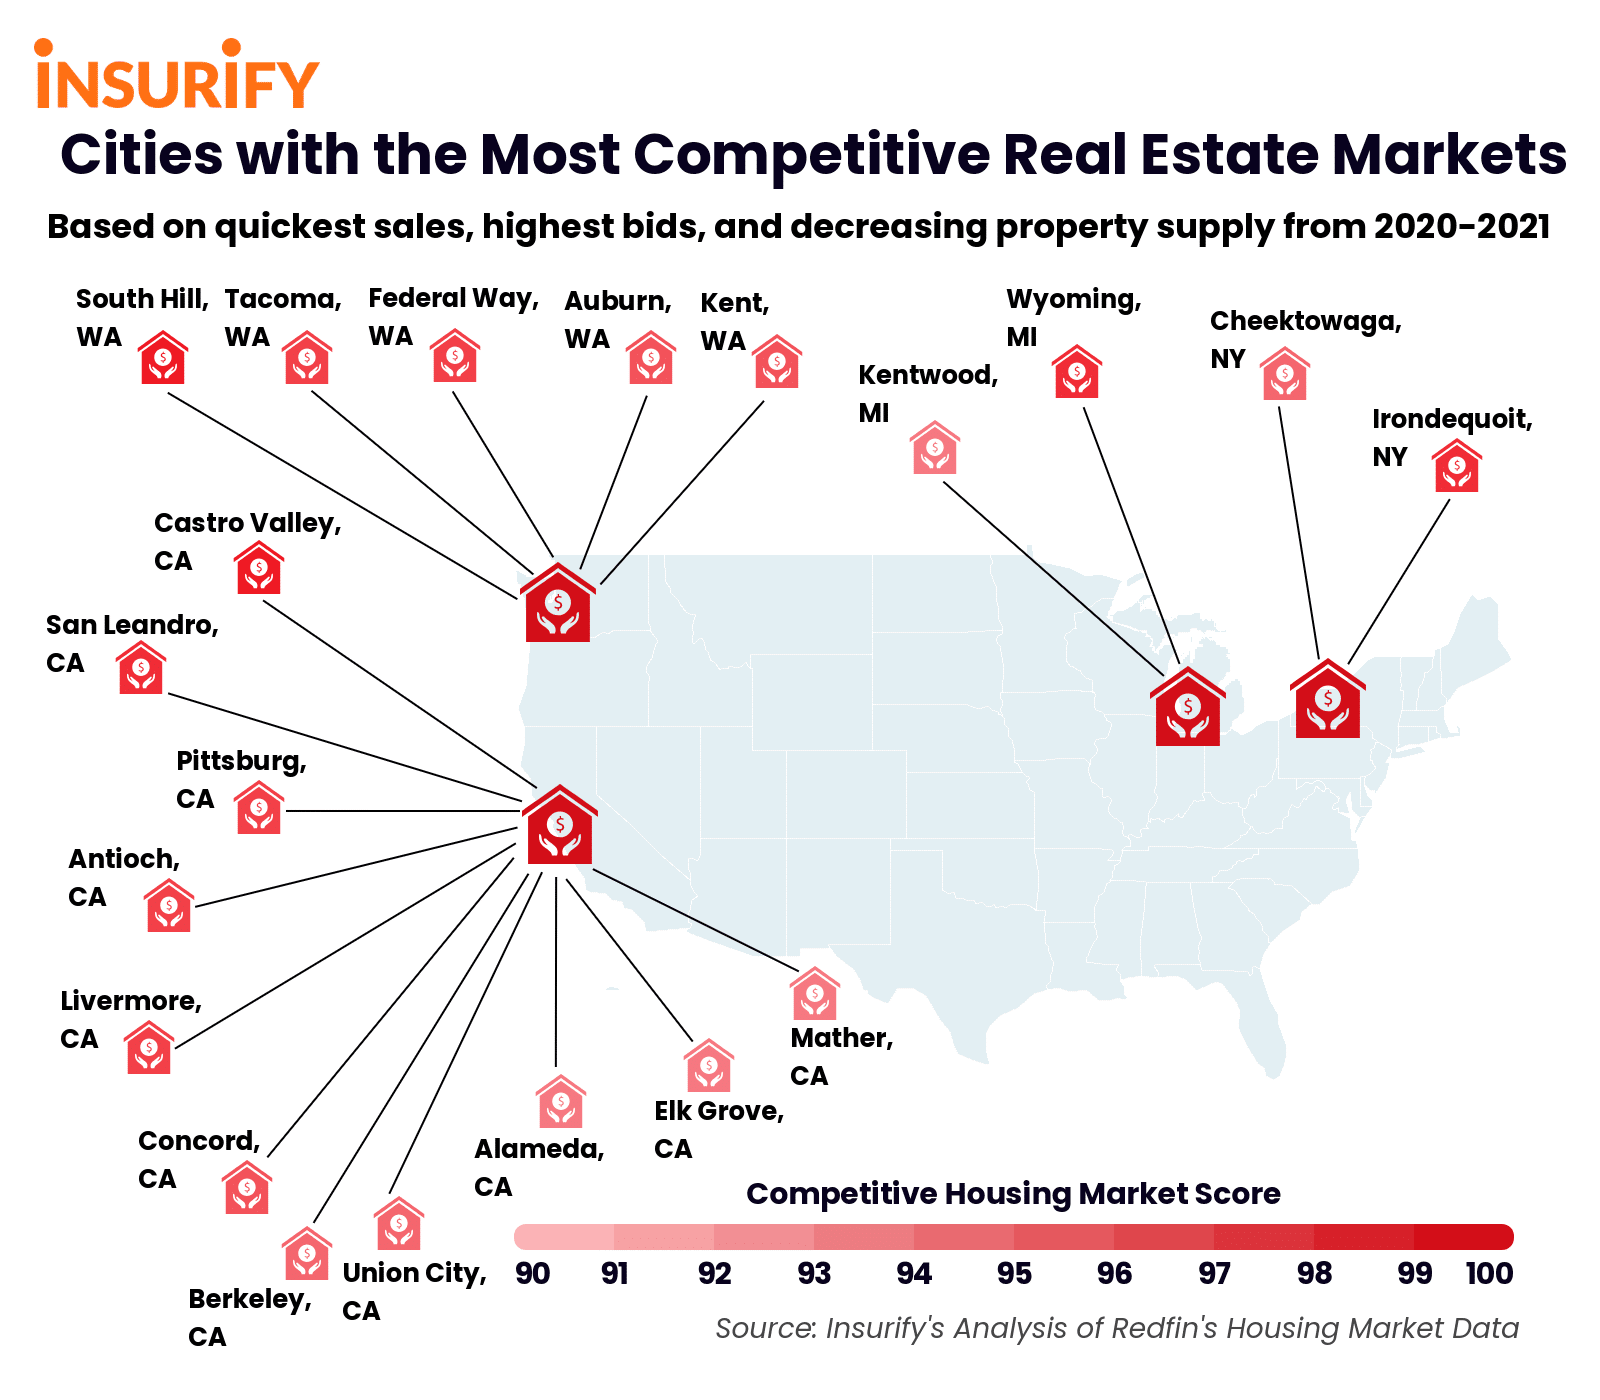
- All of the top twenty cities are located in a small handful of states. The twenty cities with the most competitive real estate markets are located in only four states: California, Washington, Michigan, and New York. California has the greatest representation of metros on the list with eleven cities; Washington has the second-highest, with five, and Michigan and New York have two each.
- Significant correlation between price per square foot and competitiveness. To understand the relationship between a city’s average cost per property and the competitiveness of its real estate market, Insurify’s data scientists conducted a regression analysis and found a significant, slightly positive correlation between the two variables (R=0.1, p=0.007). This suggests that cities whose available properties have a slightly higher sale price per square foot are likely to have a more competitive housing market.
Methodology
The data scientists at Insurify, a home insurance comparison platform, referred to Redfin’s Housing Market Data to identify the cities with the most competitive real estate markets over the past year. Cities were evaluated across three metrics: months of supply (inventory divided by home sales, which indicates how long it would take supply to be bought up if no new homes came on the market), share of homes sold above list price (percent of homes sales with a sale price greater than their latest list price covering all homes with a sale date during a given time period), and number of homes that went under contract within two weeks of their listing date.
Redfin compiles monthly data on these measures across multiple geographic levels in the United States. To calculate how competitive a city’s real estate market has been over the past year, the data scientists at Insurify took the average of each of the three metrics from February 2020-February 2021. These scaled values were then used to create a standardized composite score out of 100 for each state, where a higher score indicates a more-competitive market. Estimates for the median sale price per square foot of homes on the market in each city were additionally drawn from Redfin. In this study, cities were defined based on the United States Census Bureau’s classification of an “urbanized area,” an urban area with a population over 50,000.

Cities with Hot Real Estate Markets
As of 2021, Castro Valley, CA has the most competitive real estate market based on quickest sales, highest bids, and decreasing property supply between 2020 and 2021. Overall, California is home to the most cities with highly competitive real estate markets.
Cities with the Most Competitive Real Estate Markets
20. Mather, CA
- Competitive Market Score: 93.34 out of 100
- Percent of homes sold above list price: 54.84%
- Average number of homes per month sold within 2 weeks of listing date: 77 homes
- Average months of supply (2020-2021): 1.07
- Sale price per square foot: $243.16
19. Kent, WA
- Competitive Market Score: 93.47 out of 100
- Percent of homes sold above list price: 55.53%
- Average number of homes per month sold within 2 weeks of listing date: 74 homes
- Average months of supply (2020-2021): 0.86
- Sale price per square foot: $247.75
18. Elk Grove, CA
- Competitive Market Score: 93.50 out of 100
- Percent of homes sold above list price: 59.08%
- Average number of homes per month sold within 2 weeks of listing date: 70 homes
- Average months of supply (2020-2021): 0.9
- Sale price per square foot: $241.67
17. Kentwood, MI
- Competitive Market Score: 93.65 out of 100
- Percent of homes sold above list price: 52.59%
- Average number of homes per month sold within 2 weeks of listing date: 77 homes
- Average months of supply (2020-2021): 0.72
- Sale price per square foot: $119.75
16. Alameda, CA
- Competitive Market Score: 93.70 out of 100
- Percent of homes sold above list price: 70.55%
- Average number of homes per month sold within 2 weeks of listing date: 58 homes
- Average months of supply (2020-2021): 1.11
- Sale price per square foot: $634.75
15. Auburn, WA
- Competitive Market Score: 94.06 out of 100
- Percent of homes sold above list price: 58.08%
- Average number of homes per month sold within 2 weeks of listing date: 73 homes
- Average months of supply (2020-2021): 0.88
- Sale price per square foot: $234.67
14. Union City, CA
- Competitive Market Score: 94.38 out of 100
- Percent of homes sold above list price: 66.68%
- Average number of homes per month sold within 2 weeks of listing date: 65 homes
- Average months of supply (2020-2021): 1.03
- Sale price per square foot: $562.83
13. Berkeley, CA
- Competitive Market Score: 94.40 out of 100
- Percent of homes sold above list price: 73.12%
- Average number of homes per month sold within 2 weeks of listing date: 61 homes
- Average months of supply (2020-2021): 1.45
- Sale price per square foot: $808.42
12. Cheektowaga, NY
- Competitive Market Score: 94.98 out of 100
- Percent of homes sold above list price: 60.27%
- Average number of homes per month sold within 2 weeks of listing date: 73 homes
- Average months of supply (2020-2021): 0.91
- Sale price per square foot: $115.50
11. Federal Way, WA
- Competitive Market Score: 95.27 out of 100
- Percent of homes sold above list price: 59.03%
- Average number of homes per month sold within 2 weeks of listing date: 74 homes
- Average months of supply (2020-2021): 0.78
- Sale price per square foot: $238.33
10. Tacoma, WA
- Competitive Market Score: 95.65 out of 100
- Percent of homes sold above list price: 61.22%
- Average number of homes per month sold within 2 weeks of listing date: 73 homes
- Average months of supply (2020-2021): 0.86
- Sale price per square foot: $242.50
9. Concord, CA
- Competitive Market Score: 95.84 out of 100
- Percent of homes sold above list price: 67.63%
- Average number of homes per month sold within 2 weeks of listing date: 66 homes
- Average months of supply (2020-2021): 0.87
- Sale price per square foot: $414.17
8. Livermore, CA
- Competitive Market Score: 96.09 out of 100
- Percent of homes sold above list price: 63.71%
- Average number of homes per month sold within 2 weeks of listing date: 71 homes
- Average months of supply (2020-2021): 0.79
- Sale price per square foot: $495.83
7. Antioch, CA
- Competitive Market Score: 96.20 out of 100
- Percent of homes sold above list price: 69.74%
- Average number of homes per month sold within 2 weeks of listing date: 65 homes
- Average months of supply (2020-2021): 0.93
- Sale price per square foot: $280.58
6. Pittsburg, CA
- Competitive Market Score: 96.68 out of 100
- Percent of homes sold above list price: 69.10%
- Average number of homes per month sold within 2 weeks of listing date: 66 homes
- Average months of supply (2020-2021): 0.85
- Sale price per square foot: $303.33
5. Wyoming, MI
- Competitive Market Score: 97.11 out of 100
- Percent of homes sold above list price: 61.90%
- Average number of homes per month sold within 2 weeks of listing date: 76 homes
- Average months of supply (2020-2021): 0.77
- Sale price per square foot: $123.33
4. South Hill, WA
- Competitive Market Score: 97.19 out of 100
- Percent of homes sold above list price: 61.49%
- Average number of homes per month sold within 2 weeks of listing date: 76 homes
- Average months of supply (2020-2021): 0.72
- Sale price per square foot: $201.91
3. Irondequoit, NY
- Competitive Market Score: 97.83 out of 100
- Percent of homes sold above list price: 65.90%
- Average number of homes per month sold within 2 weeks of listing date: 73 homes
- Average months of supply (2020-2021): 0.73
- Sale price per square foot: $101.50
2. San Leandro, CA
- Competitive Market Score: 97.87 out of 100
- Percent of homes sold above list price: 71.76%
- Average number of homes per month sold within 2 weeks of listing date: 67 homes
- Average months of supply (2020-2021): 0.91
- Sale price per square foot: $528.16
1. Castro Valley, CA
- Competitive Market Score: 98.45 out of 100
- Percent of homes sold above list price: 72.07%
- Average number of homes per month sold within 2 weeks of listing date: 68 homes
- Average months of supply (2020-2021): 0.86
- Sale price per square foot: $529.25
If you have any questions or comments about this article or would like to request the data, please contact insights@insurify.com.
More From KSSM-FM